
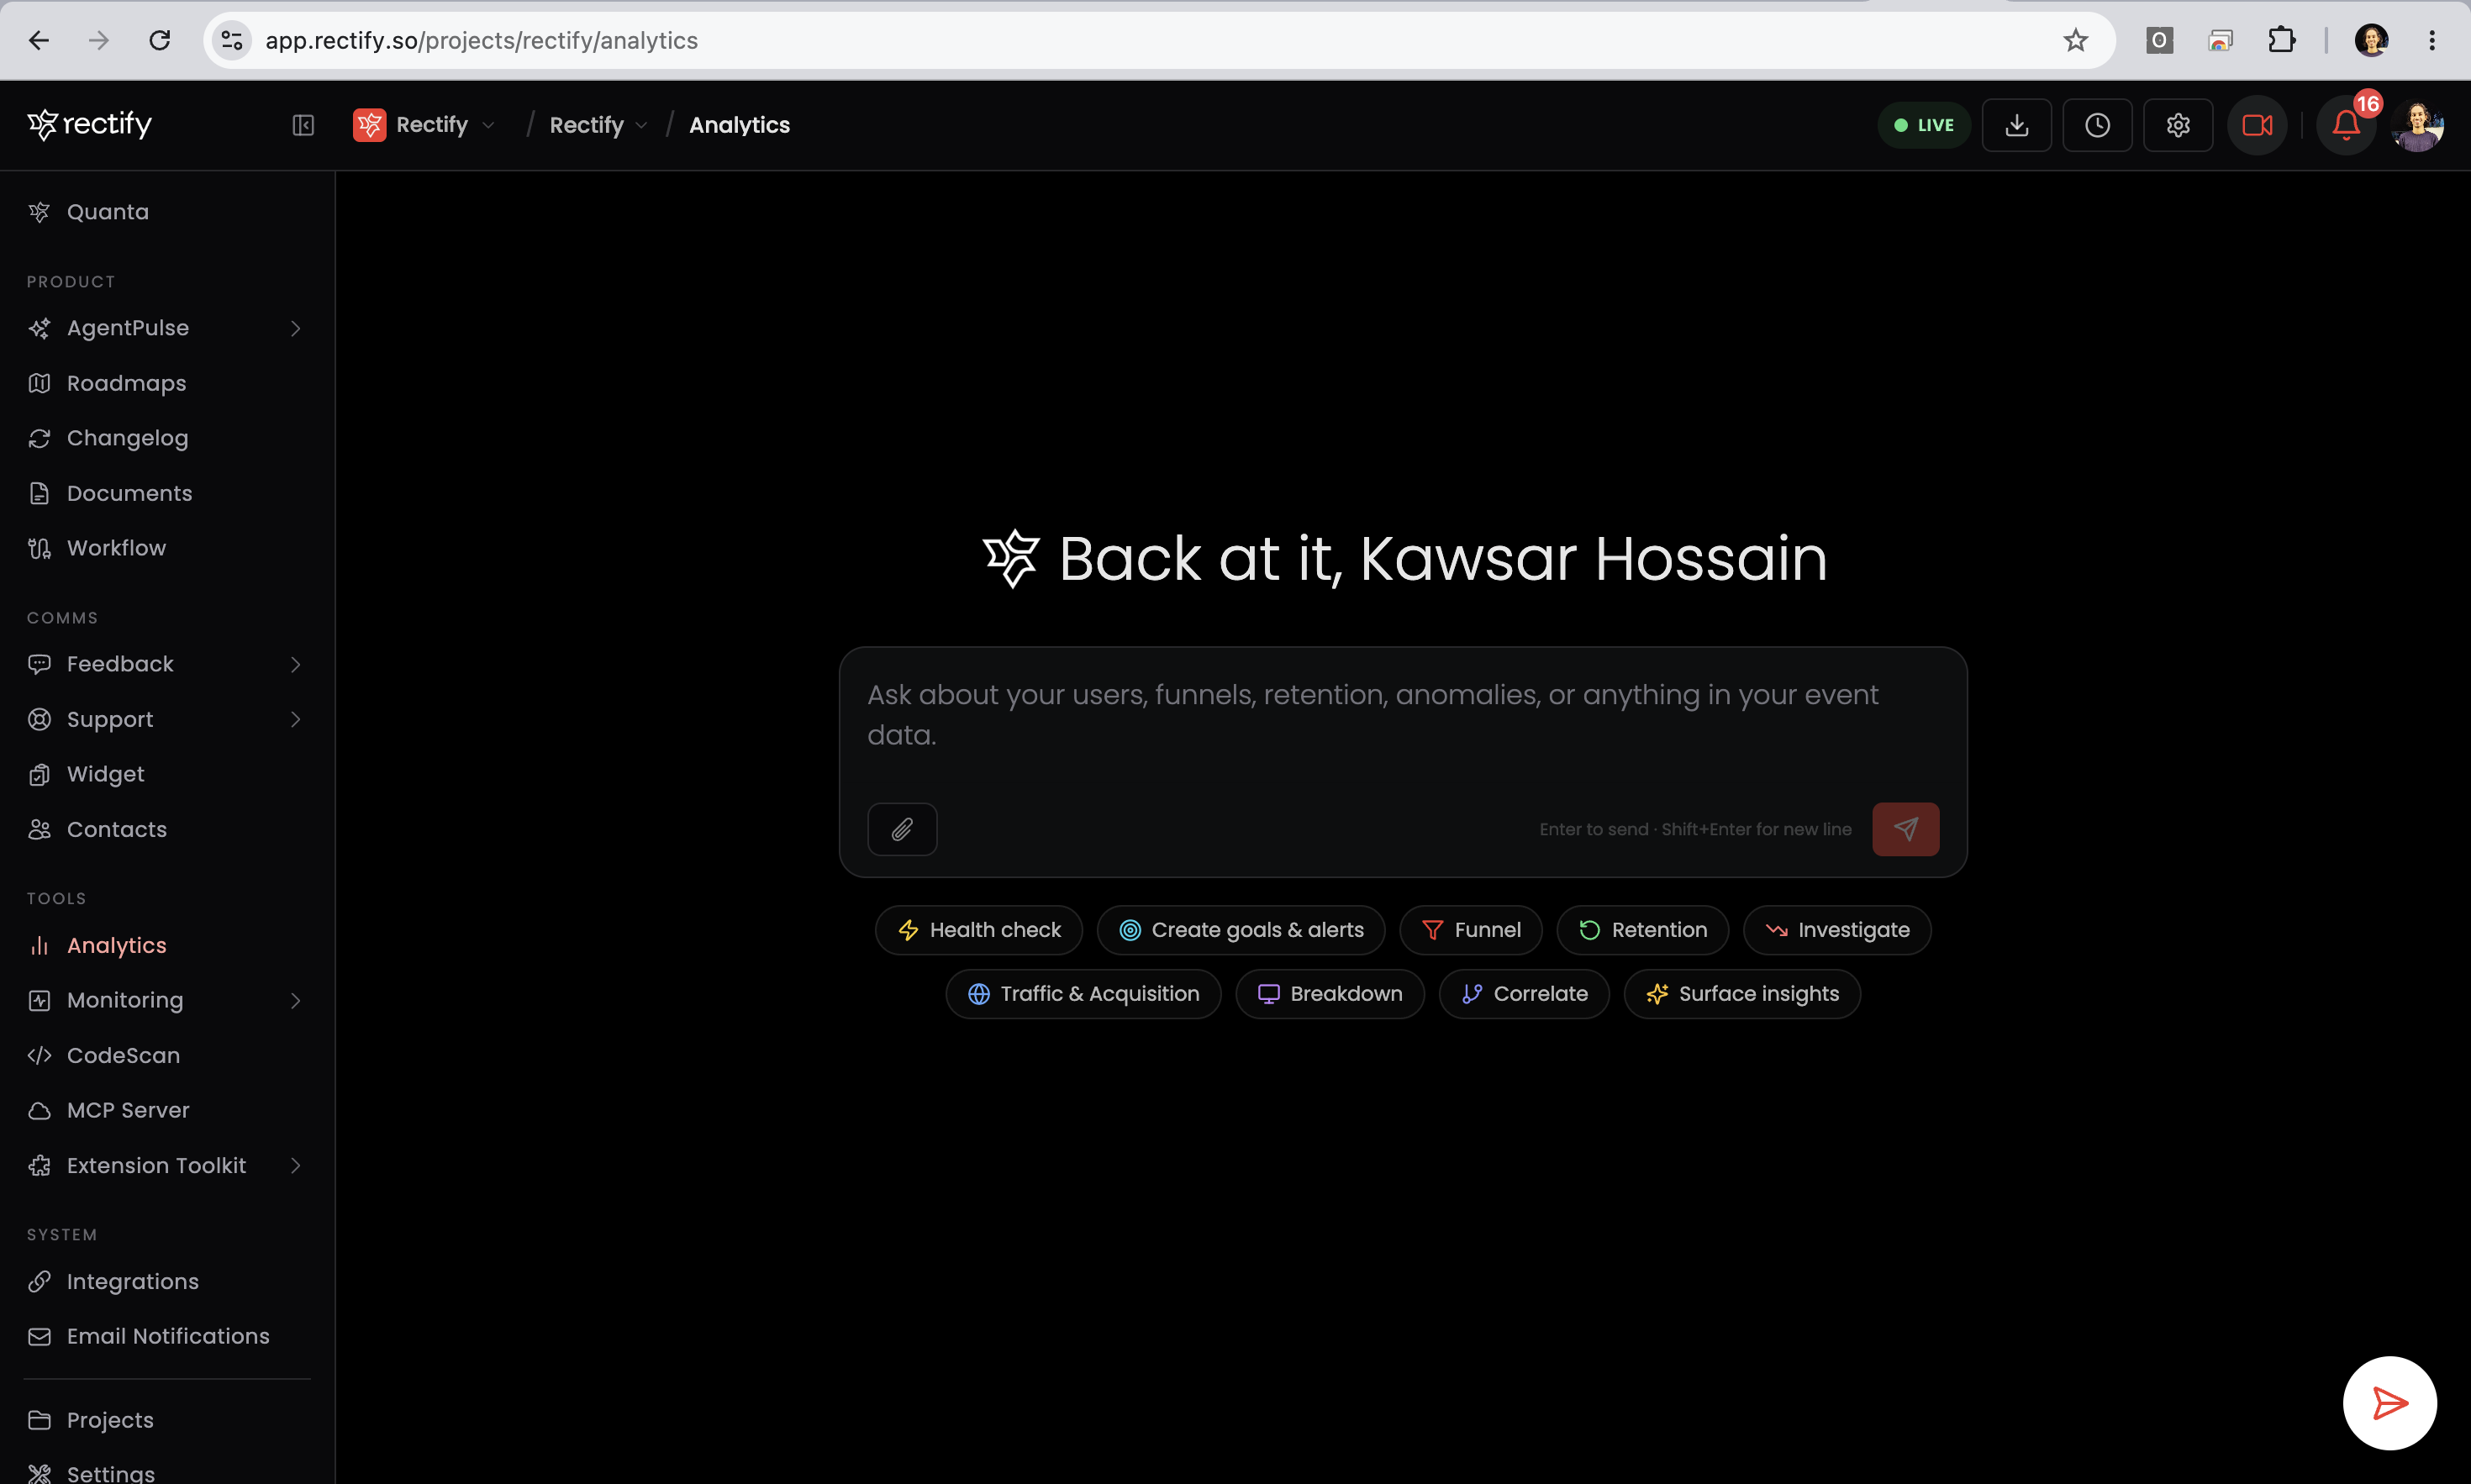
Introducing Rectify Analytics: ask your product data anything
KKawsar Hossain28 Jul 2026
Analytics has always been backwards. You have a question, so you go find a dashboard, then a filter, then a date picker, then a second dashboard to explain the first one. Twenty minutes later you have a number and still no idea what to do about it.
Rectify Analytics starts from the question instead.
Type "why did activation drop this week?" and you get an answer: the number, the direction, the most likely cause, the evidence behind that claim, and the next thing to do. Not a chart you have to interpret. An answer you can act on.
What it is
Rectify Analytics is a product analyst that lives inside Rectify. It collects your product events, and it gives you an agent that can query them, correlate them with everything else Rectify already knows about your product, and tell you what's going on in plain English.
It's built on the thing no standalone analytics tool has: context. Rectify already holds your incidents, your user feedback, your changelog, and your roadmap. So when your signups drop, the agent doesn't just show you a smaller bar. It checks whether you had an outage, whether users reported anything, and whether you shipped a release that morning.
That correlation is the whole point. Numbers tell you what changed. Rectify tells you why.
How it works
1. Drop in one script. Setup is a copy-paste snippet and a toggle. If you already run the Rectify widget, you're one switch away, same bundle and no second script. Running analytics without the chat launcher is a single flag, so you can instrument a marketing site without putting a support widget on it.
2. Events start flowing. Pageviews, clicks, scroll depth, form submissions, element visibility, and Core Web Vitals are captured automatically. Custom events and revenue are one call away. Bot traffic is filtered at the edge before it ever reaches your numbers, so your funnels aren't quietly inflated by crawlers.
3. Ask. Open Analytics and type. The agent picks its own tools, runs the queries, correlates across surfaces, and writes up what it found, with a chart when a chart actually helps.
You'll also find a live indicator in the header showing whether events are arriving right now, so you never have to wonder whether you're looking at real data or a broken integration.
What it can do
The agent has real query tools. It isn't guessing from a summary table.
Core metrics. Pageviews, unique visitors, sessions, session depth and duration, identified users, period-over-period comparison, and a real-time view of who's on your product in the last five minutes.
Breakdowns. Top pages, top events, referrers and acquisition channels, UTM source/medium/campaign, browser/OS/device, and country.
The hard questions. Multi-step conversion funnels with per-step drop-off, cohort retention, first- and last-touch attribution, revenue and transactions, Core Web Vitals at p50/p75/p90 with Good/Needs-Improvement/Poor ratings, and automated anomaly detection that compares today against your rolling 7-day baseline.
Cross-surface correlation. The agent can pull incidents that overlapped a time window, recent user feedback, and published changelog entries, then connect them to the metric you asked about.
Discovery. New to a codebase or inherited a project? The agent lists every event actually being tracked and the properties attached to each one, so it never invents an event name that doesn't exist.
Goals and alerts. Describe what you want in a sentence. "Alert me when daily pageviews drop below normal." The agent creates it. Goals track conversions, unique converters, conversion rate, and revenue against an event or a URL path. Alerts evaluate every 15 minutes and reach you in-app or by email.
Attachments. Paste a screenshot straight into the chat. A competitor's dashboard, a funnel diagram, a spec PDF, a broken page. The agent reads it and, critically, treats it as a claim to verify rather than the answer. It pulls the matching metric for the same window from your own data and tells you where the two agree and where they don't.
Export and MCP. Pull raw events as CSV or JSON over 7, 30, 90, or 180 days. Or connect Analytics to Claude Code, Cursor, or Windsurf over MCP and query your product data from inside your editor, next to the code you're about to change.
Why not a dashboard?
To be clear: you still get charts. The agent renders line, bar, area, and pie charts inline whenever the data is visual. What you don't get is a wall of them waiting for you every morning.
Dashboards optimize for the questions someone anticipated months ago. Your actual questions are specific, they're urgent, and they're usually a follow-up to something you just saw. "Okay, but which cohort?" "Is that just mobile?" "Did that start before or after Tuesday's release?" A dashboard can't answer those. It can only show you a new place to start looking.
And dashboards make you do the expensive part yourself. A line goes down, the dashboard's job is done and yours begins: pull up the incident log, skim feedback, check what shipped. That's the work. That's what we automated.
So: charts where a chart is genuinely the clearest answer, and prose everywhere else. Two or three sentences, the evidence, the recommended action. No dashboard to maintain, no saved views to prune, no reports nobody opens.
How agentic is it, really?
Fully. This is not a chat box wrapped around a fixed report.
It plans. Given a question, the agent decides which of its 20+ tools to call and in what order. Ask for a health check and it runs anomaly detection, checks who's live, pulls a week-over-week snapshot, and then, only if it finds something off, goes digging through incidents and releases for a cause. The investigation shapes itself around what it finds.
It acts. It can create conversion goals, set up metric alerts, open roadmap cards, and draft changelog entries. These are real writes to your workspace, which is exactly why every one of them is confirm-first: the agent shows you a preview and waits. Nothing is created behind your back.
It asks instead of guessing. When it's missing something it genuinely can't look up, like which event a goal should track, what threshold you want, or which of two readings of your question you meant, it stops and asks with a proper form, all fields at once. It does not invent a plausible-looking value and move on.
It refuses to make things up. The agent only states numbers its tools returned. If the data isn't there, it says the data isn't there and tells you what to instrument to get it. An empty result is a finding, not a prompt to improvise.
It remembers. Conversations are threaded and persistent. Attachments you sent three turns ago stay in context. You can follow up, narrow down, change your mind, and come back tomorrow.
Getting started
Analytics is available on Build and above.
Open any project, go to Analytics, paste the snippet, and flip the toggle. Events usually start appearing within seconds, and the live indicator will tell you the moment they do.
Then ask it something hard.
Get updates like this by email
One email when something ships. Nothing in between.