See where people click and how far they scroll on any page, drawn on a snapshot of the page itself.
4 min readUpdated 5 days ago
Before you start. Heatmaps come from the Rectify script, so it needs to be live on your site for a while. Everyone in the project can open them.
A heatmap shows what people do on one page of your site: where they click, which elements frustrate them, and how far down they get. Rectify draws it on a snapshot of your real page.
Open a page's heatmap
1.
Open Heatmaps in the sidebar, under Customers. Your busiest page with clicks opens first.
2.
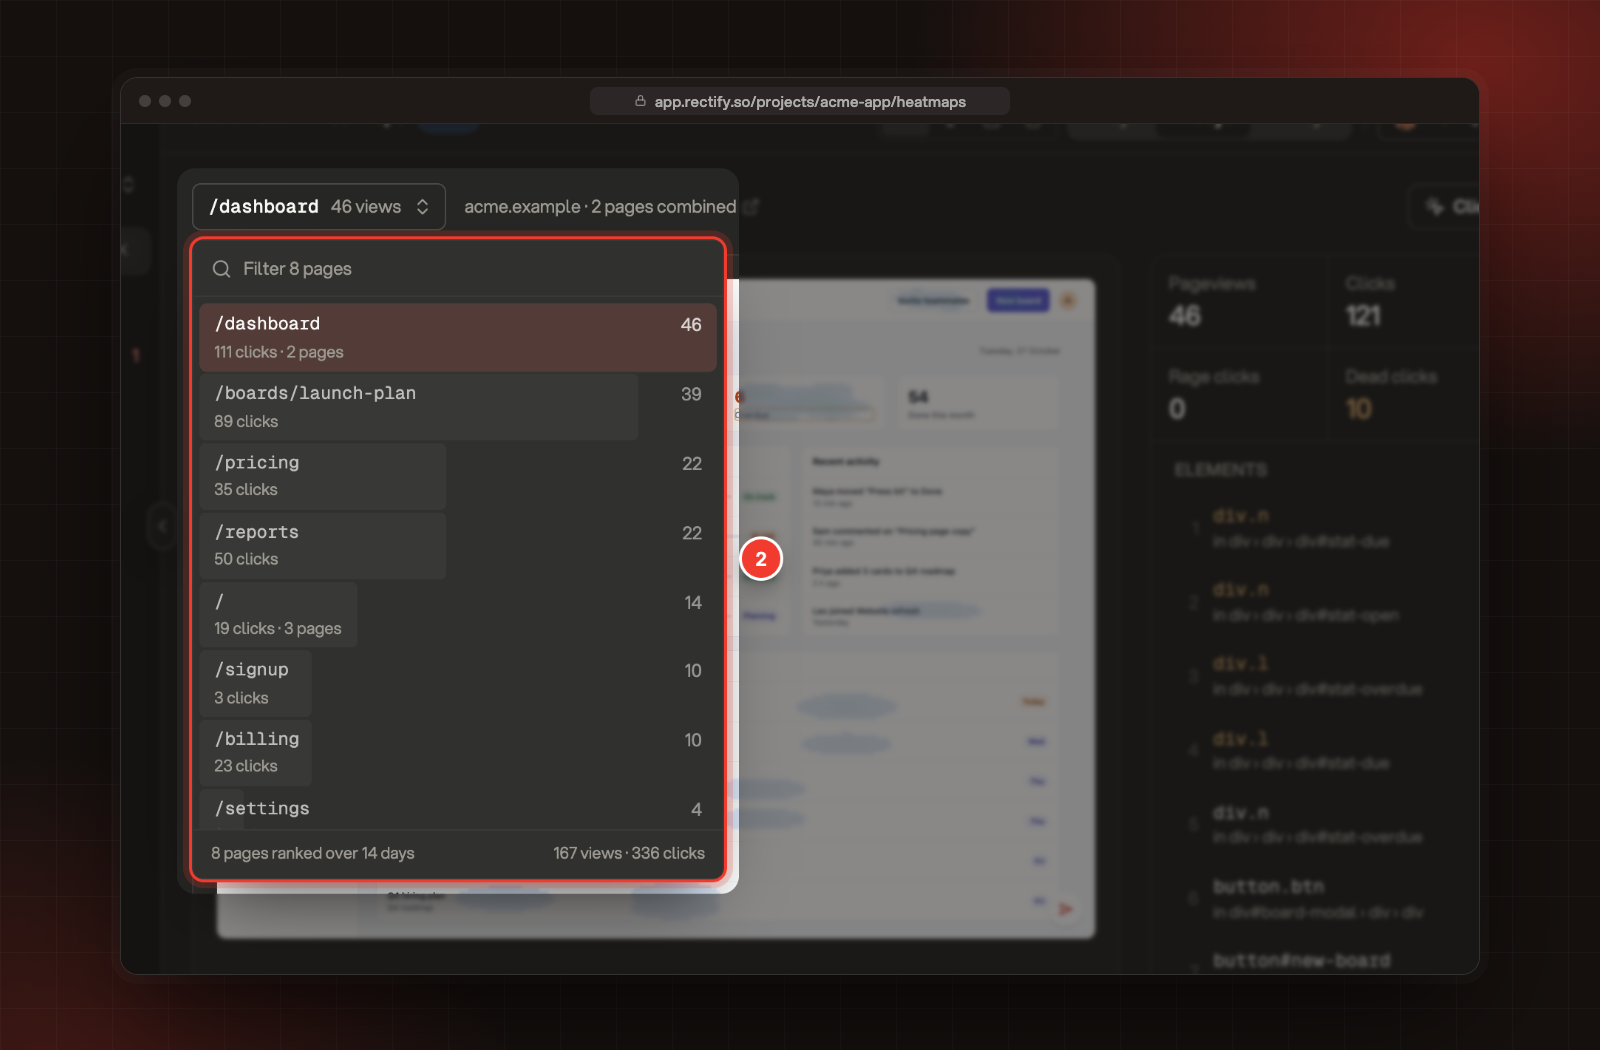
To pick another page, select the page button at the top left and choose from the list. Pages are ranked by views, with their clicks next to them. Type to filter the list.
2 The page list, ranked by views.
3.
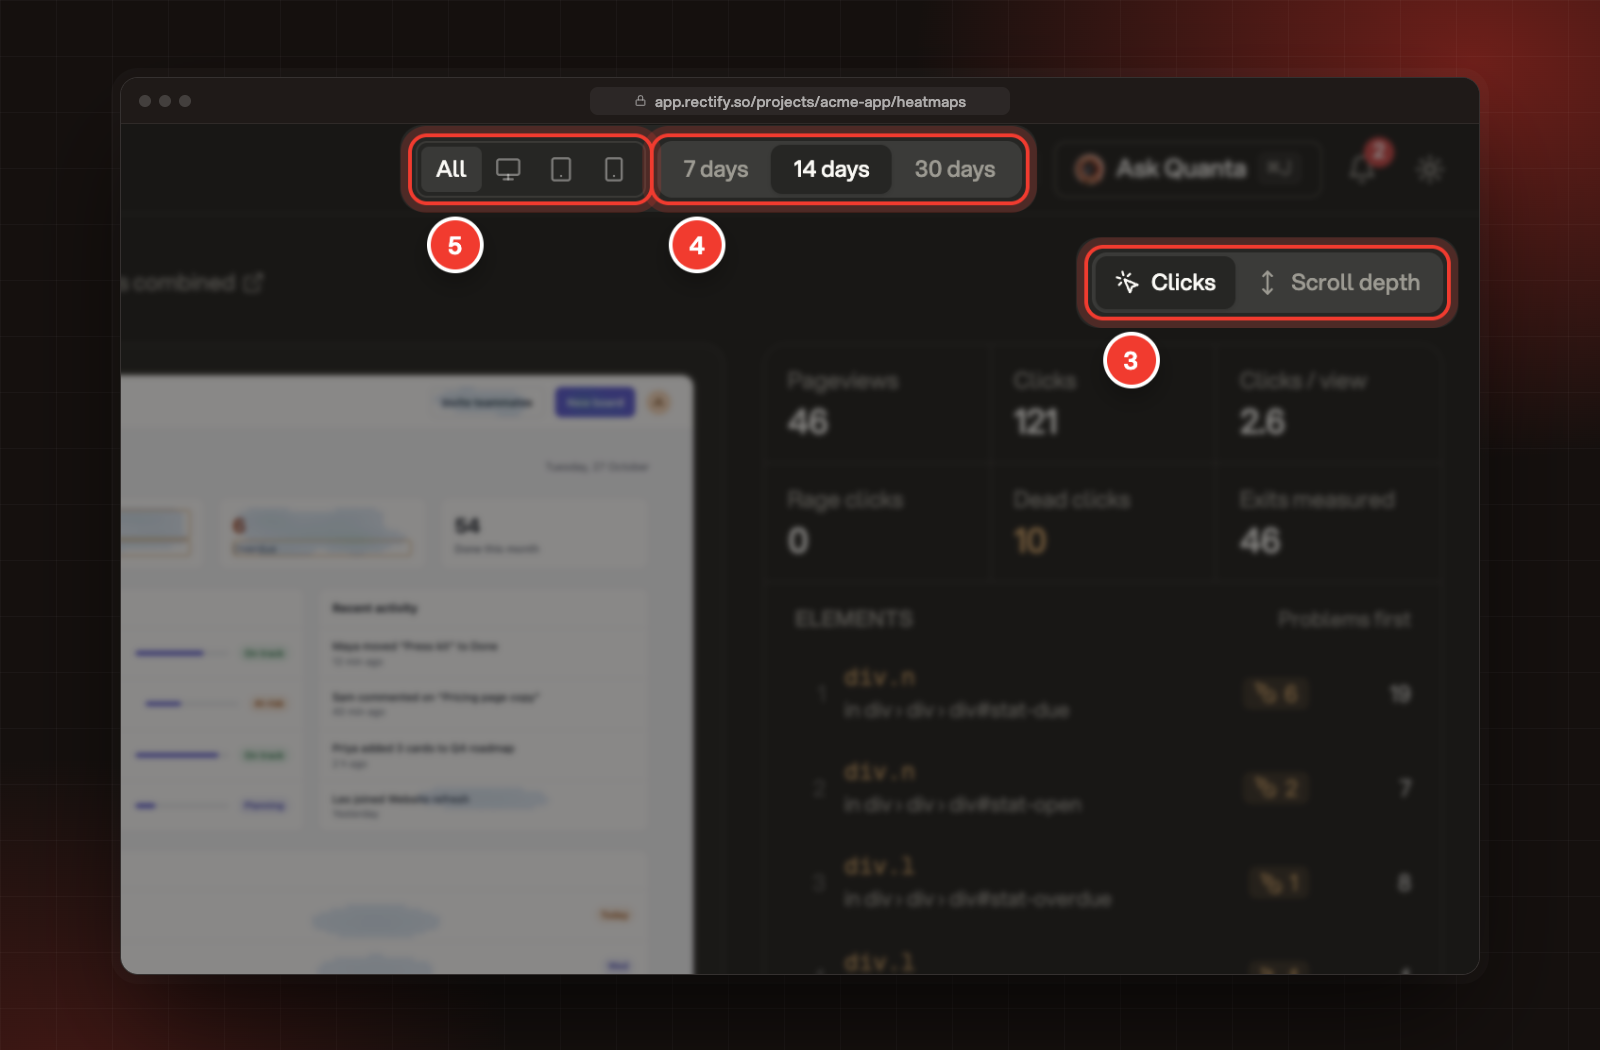
Pick Clicks or Scroll depth.
4.
Choose a window: 7 days, 14 days or 30 days.
5.
To see one kind of device, select Desktop, Tablet or Mobile next to All.
3 Clicks or Scroll depth. 4 The time window. 5 The device filter.
Pages whose addresses differ only by an ID, for example /orders/1042 and /orders/1043, are combined into one entry. The address ignores anything after ? or #.
Read the click map
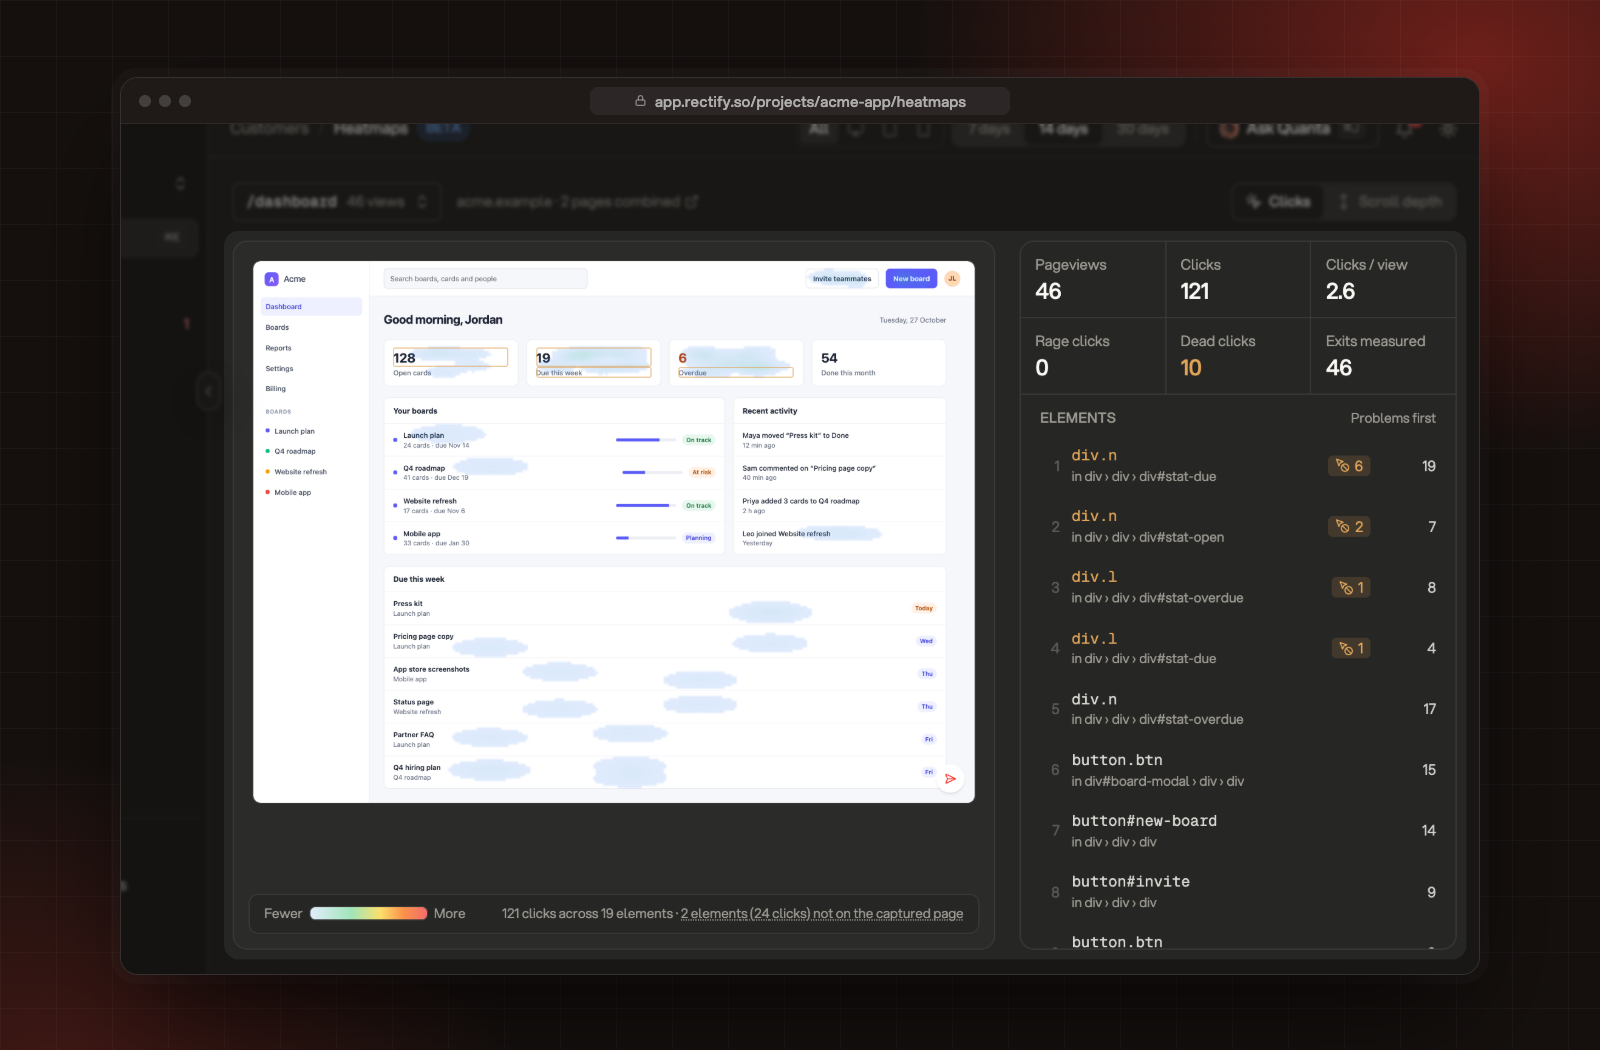
The click map on the page, with the busiest elements listed on the right.
•
The glow shows where clicks landed inside each element, from blue (Fewer) to red (More).
•
An amber border marks an element with rage clicks or dead clicks.
•
Hover over an element to see its clicks, its share of the page's clicks, and its rage and dead clicks.
The panel on the right sums up the page:
Number
What it means
Pageviews
Times the page was loaded in the window.
Clicks
Clicks recorded with a position on the page.
Clicks / view
Average clicks per pageview. Very low usually means the page is read, not used.
Rage clicks
Three or more clicks on the same element within a second.
Dead clicks
Clicks on something clickable that produced no visible response.
Exits measured
Visits that left a scroll depth when they ended.
Under Elements, the most-clicked elements are listed with problems first. Select one to scroll the page to it. Elements are named after their data-rectify-id, data-testid or ID, so giving key buttons one of these makes the list easier to read.
Read the scroll map
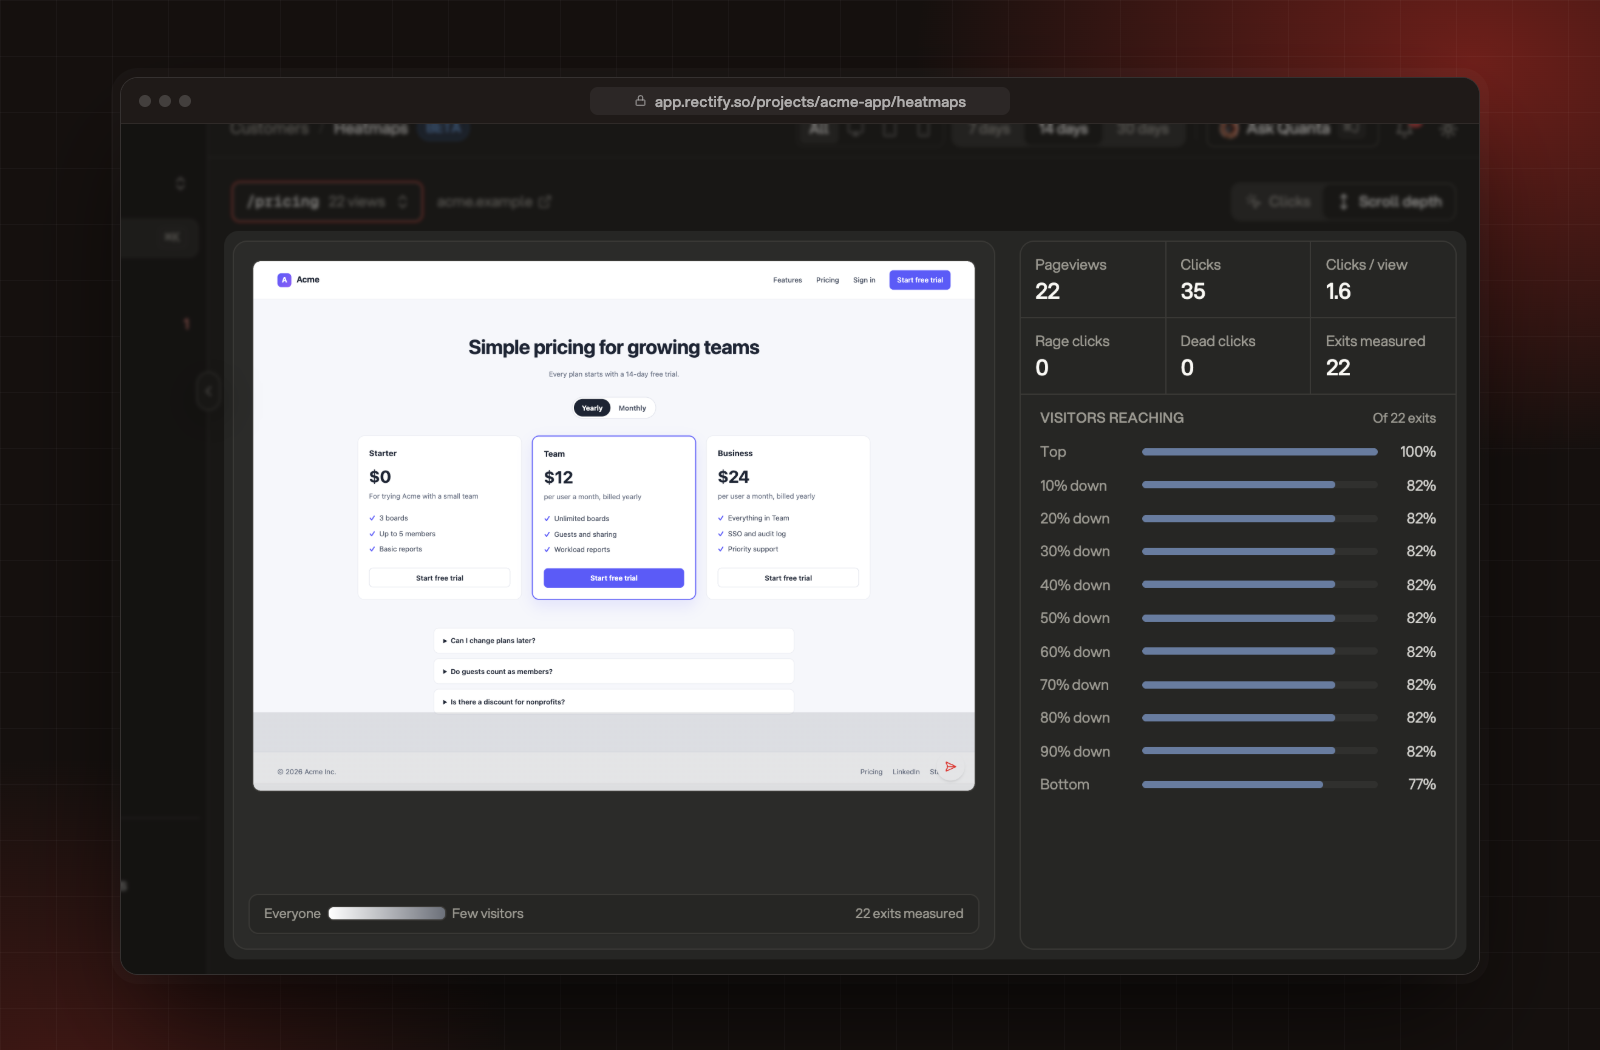
Pick Scroll depth. The page darkens from top to bottom as fewer people reach each part, from Everyone to Few visitors. Lines mark where 75% of visitors are still reading, where half have stopped, and where only 25% remain. The panel shows Visitors reaching each 10% of the page.
The scroll map of the pricing page, with the share of visitors reaching each part.
How fresh it is
•
New clicks reach the click map within about an hour.
•
The page snapshot is captured at most once a day per page and device, the first time someone visits it with the script live. If the page has changed since, a few elements may no longer match, and the footer says how many.
•
Parts of the page you've marked as private stay private in the snapshot: text marked data-rectify-mask shows as asterisks, and rectify-no-capture areas show as empty boxes. Keep analytics private: masking, Do Not Track and form fields explains both.
Check it worked
The footer under the page reads, for example, 312 clicks across 24 elements in click mode or 48 exits measured in scroll mode.
"No page snapshot yet"
The snapshot is taken when someone visits the page with the script live. Check that Record sessions or Capture technical logs is on under Publish, Widget, Privacy: the snapshot is taken by the same recorder.
"No element clicks recorded"
The page has views but no clicks in this window and device. Try 30 days or All devices, and check that Clicks is on in the analytics Capture settings.
"The captured page snapshot could not be rendered."
The snapshot was damaged or too large to draw. A fresh one is captured the next time someone visits the page with the script live.
The numbers in the page list differ from the panel
The list counts clicks as they arrive, while the map counts them once an hour and includes rage and dead clicks. They line up after the next hourly update.