Create a monitor: HTTP, TCP port, Ping, DNS or Heartbeat
Watch a website, an API, a port, a DNS record or a scheduled job, and hear about it the moment it stops working.
5 min readUpdated 24 days ago
Before you start. Anyone on your team who can open the project can add monitors. How many monitors you can have, and how often they're checked, depends on your plan (see the table below).
A monitor checks one thing on a schedule: a page or API, a port, a DNS record, a host, or a job that should check in with Rectify. When the checks fail, Rectify opens an incident and alerts the channels you pick.
Add a monitor
1.
Open Monitoring, then Monitors.
2.
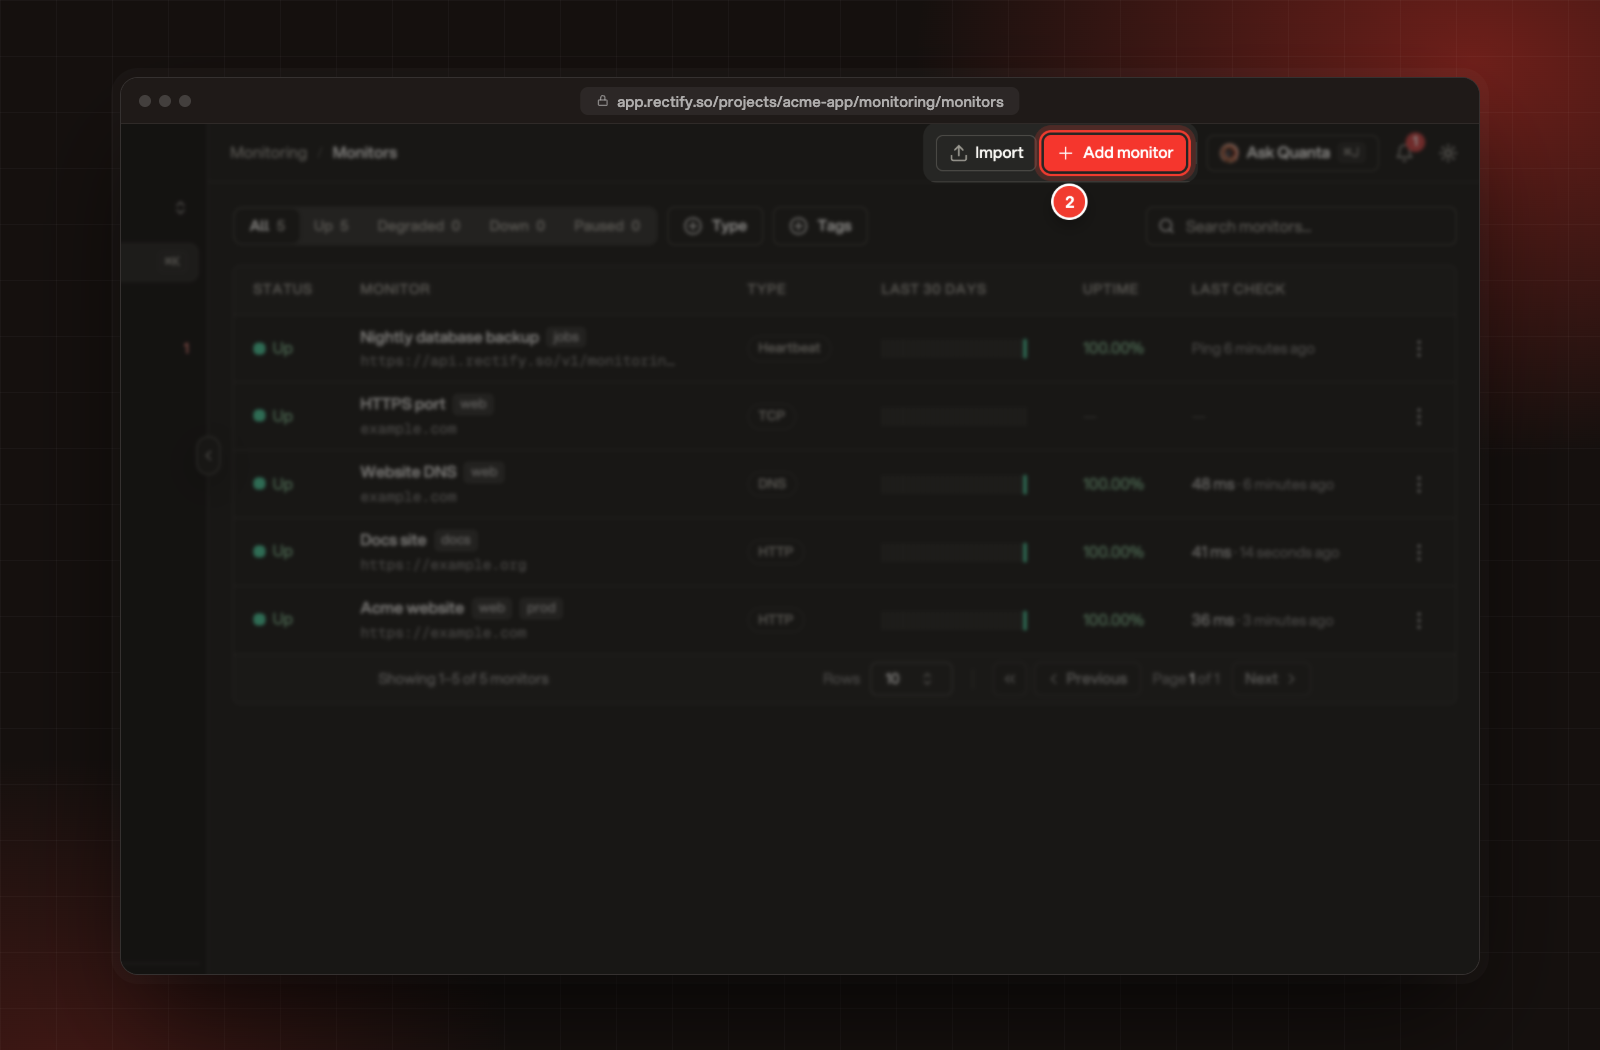
Select Add monitor. If you have no monitors yet, select Let's GO! instead.
2 Add monitor, at the top of the Monitors page.
3.
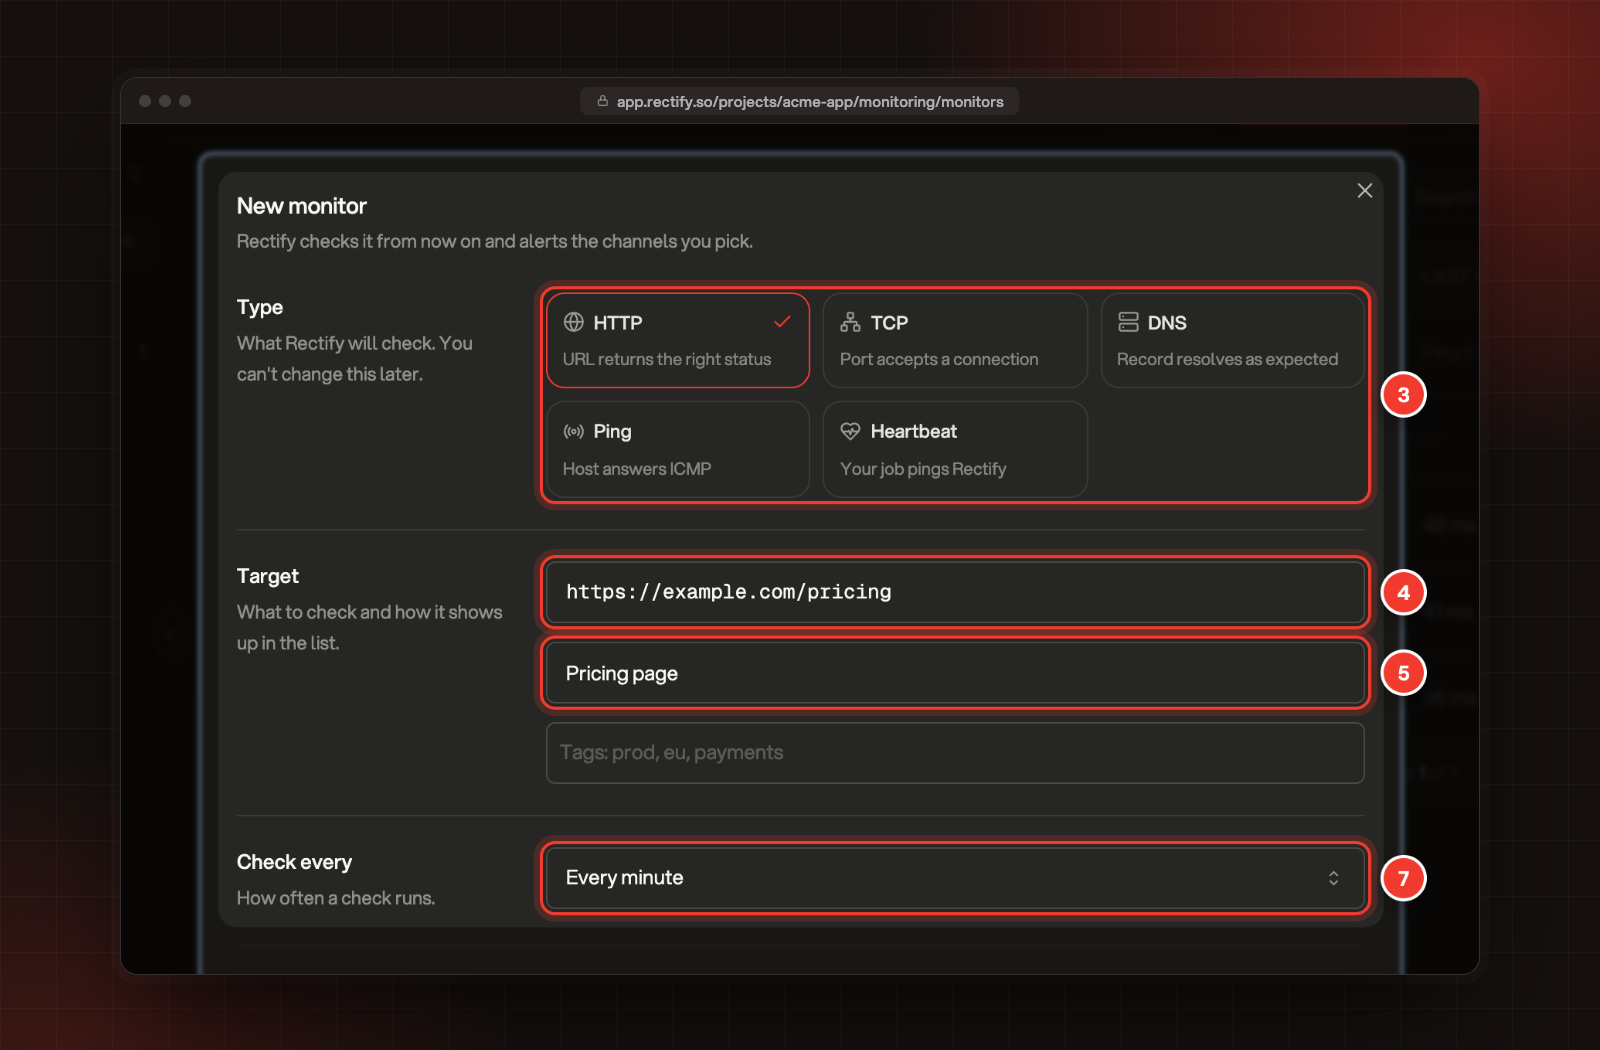
Under Type, pick what to check: HTTP, TCP, DNS, Ping or Heartbeat. You can't change the type later.
4.
Enter the address to check. The table below shows what each type needs.
5.
Enter a name. If you leave it empty, Rectify fills in the host name for you.
6.
Add tags if you like, such as prod or payments. Press Enter or a comma after each one. You can use up to 10 tags.
7.
Under Check every, choose how often Rectify checks it.
3 Type. 4 The address. 5 Name. 7 Check every.
8.
Select Create monitor.
The monitor shows up in the list straight away, and its first check runs within one interval. Alert when and Notify are optional here. Add assertions and smart checks and Set up alerting cover them.
What each type checks
Type
What it checks
What to enter
HTTP
The URL answers with an accepted status code (200 unless you change it)
A full URL that starts with http:// or https://
TCP
The host accepts a connection on a port
A host name or IP address, and the Port (1 to 65535)
DNS
A record resolves
A domain, such as example.com
Ping
The host answers ping (ICMP)
A host name or IP address
Heartbeat
Your own job calls Rectify on time
Only a name. Rectify gives you the address to call
For more control, select Show request options:
•
HTTP: the Method, Timeout (ms) (1,000 to 60,000, 30,000 by default), Follow redirects, Headers, and a Request body for POST, PUT and PATCH.
•
TCP: the Connection timeout (ms).
•
DNS: the Record type (A, AAAA, CNAME, MX, TXT or NS, A by default) and an Expected value. With an expected value, the check fails when no record contains it.
•
Every type: a Description of what the monitor watches and who owns it.
Watch a scheduled job with Heartbeat
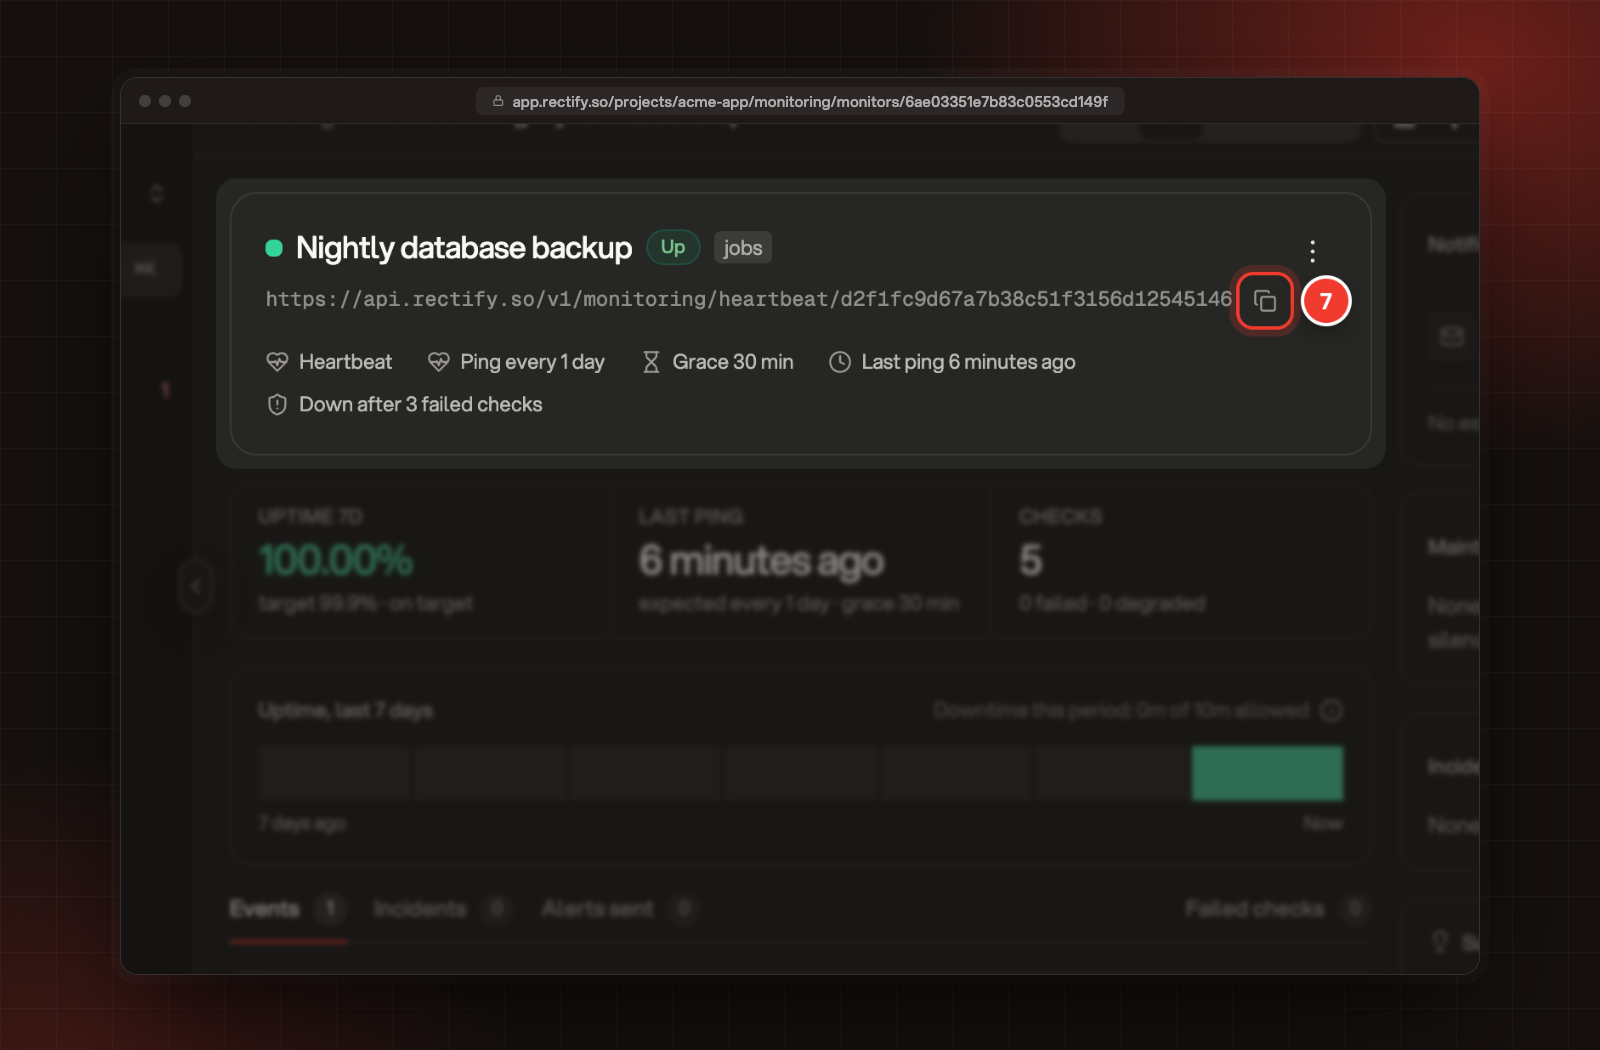
A Heartbeat monitor works the other way round. Your job (a backup, an import, a cron task) calls a unique address when it finishes. If the call doesn't arrive on time, Rectify treats the job as failed.
1.
Open Monitoring, then Monitors, and select Add monitor.
2.
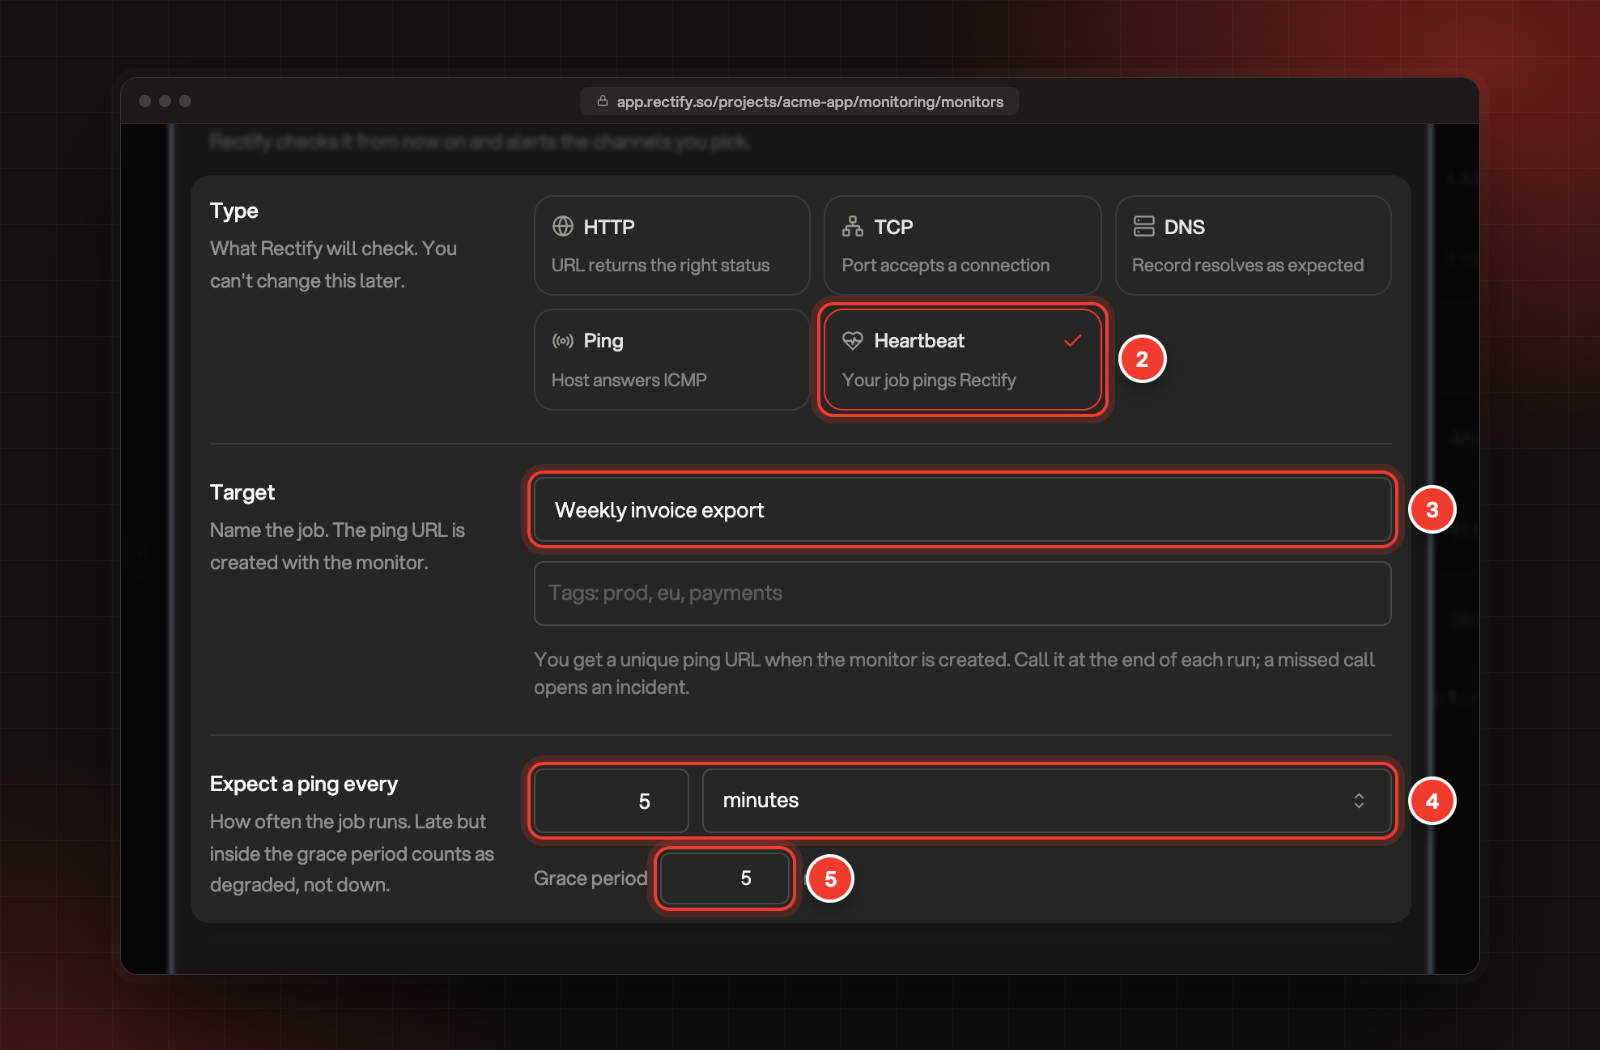
Under Type, select Heartbeat.
3.
Name the job, for example "Weekly invoice export".
4.
Under Expect a ping every, enter how often the job runs and pick minutes, hours or days. It can be anything from 1 minute to 30 days.
5.
Set the Grace period in minutes. A ping that's late but inside the grace period counts as degraded, not down.
To report a run that failed, call the same URL with /fail on the end. Rectify records a failed check straight away instead of waiting for the grace period.
Rectify re-checks Heartbeat monitors every minute, and the monitor goes down after the number of failed checks in a row you set (3 by default). Keep the ping URL private: anyone who has it can check in for your job.
Monitors and check intervals on each plan
Plan
Monitors
Fastest check
Idea (free)
1
Every 10 minutes
Build
3
Every 5 minutes
Launch
10
Every minute
Accelerate
25
Every minute
Enterprise
Unlimited
Every minute
Monitors count across your whole organization, not per project. Intervals faster than your plan allows show the plan they need in the Check every list. Compare plans and what each one includes has the full list.
Moving from another uptime tool? Select Import on the Monitors page to bring in monitors from UptimeRobot, Better Stack, Pingdom or StatusCake, or paste a CSV or a list of URLs.
Check it worked
Open Monitoring, then Monitors. Your monitor shows Up once its first check passes, with its uptime and the time of the last check. Select it to see its checks, response times and incidents.
It says "Monitors cannot target local or internal hostnames"
Rectify only checks addresses on the public internet. Addresses such as localhost, internal host names and private or reserved IP ranges are blocked. Use the public address of the service.
It says "DNS resolution failed - host not found"
The host name doesn't exist yet, or it's misspelled. Check it opens from a browser or resolves with a DNS lookup tool, then try again.
Create monitor is greyed out
A required field is missing, such as the address, the name (at least 2 characters) or the TCP port. If the dialog says "You have reached the number of monitors your plan allows", every monitor on your plan is in use. Upgrade your plan, or ask an Owner or Admin to delete a monitor you no longer need. Pausing a monitor doesn't free its place.
My Heartbeat monitor went down even though the job ran
The job has to call the ping URL every time it finishes. Check the job reaches the internet, that the URL is copied in full, and that the interval under Expect a ping every matches how often the job really runs. Allow for slow runs with a longer Grace period.