Show customers live uptime, incidents and planned maintenance on your portal, and let them subscribe to updates.
3 min readUpdated 5 days ago
Before you start. Owners, Admins and Members can change the portal. The status page is part of your portal and shows the monitors in this project, so add at least one monitor first.
Your status page lives on your portal, next to your requests, roadmap and changelog. It shows whether your services are up, the incidents you're working on, past incidents and planned maintenance.
Turn on the status page
1.
Open Publish, then Portal.
2.
Select the Brand tab on the right.
3.
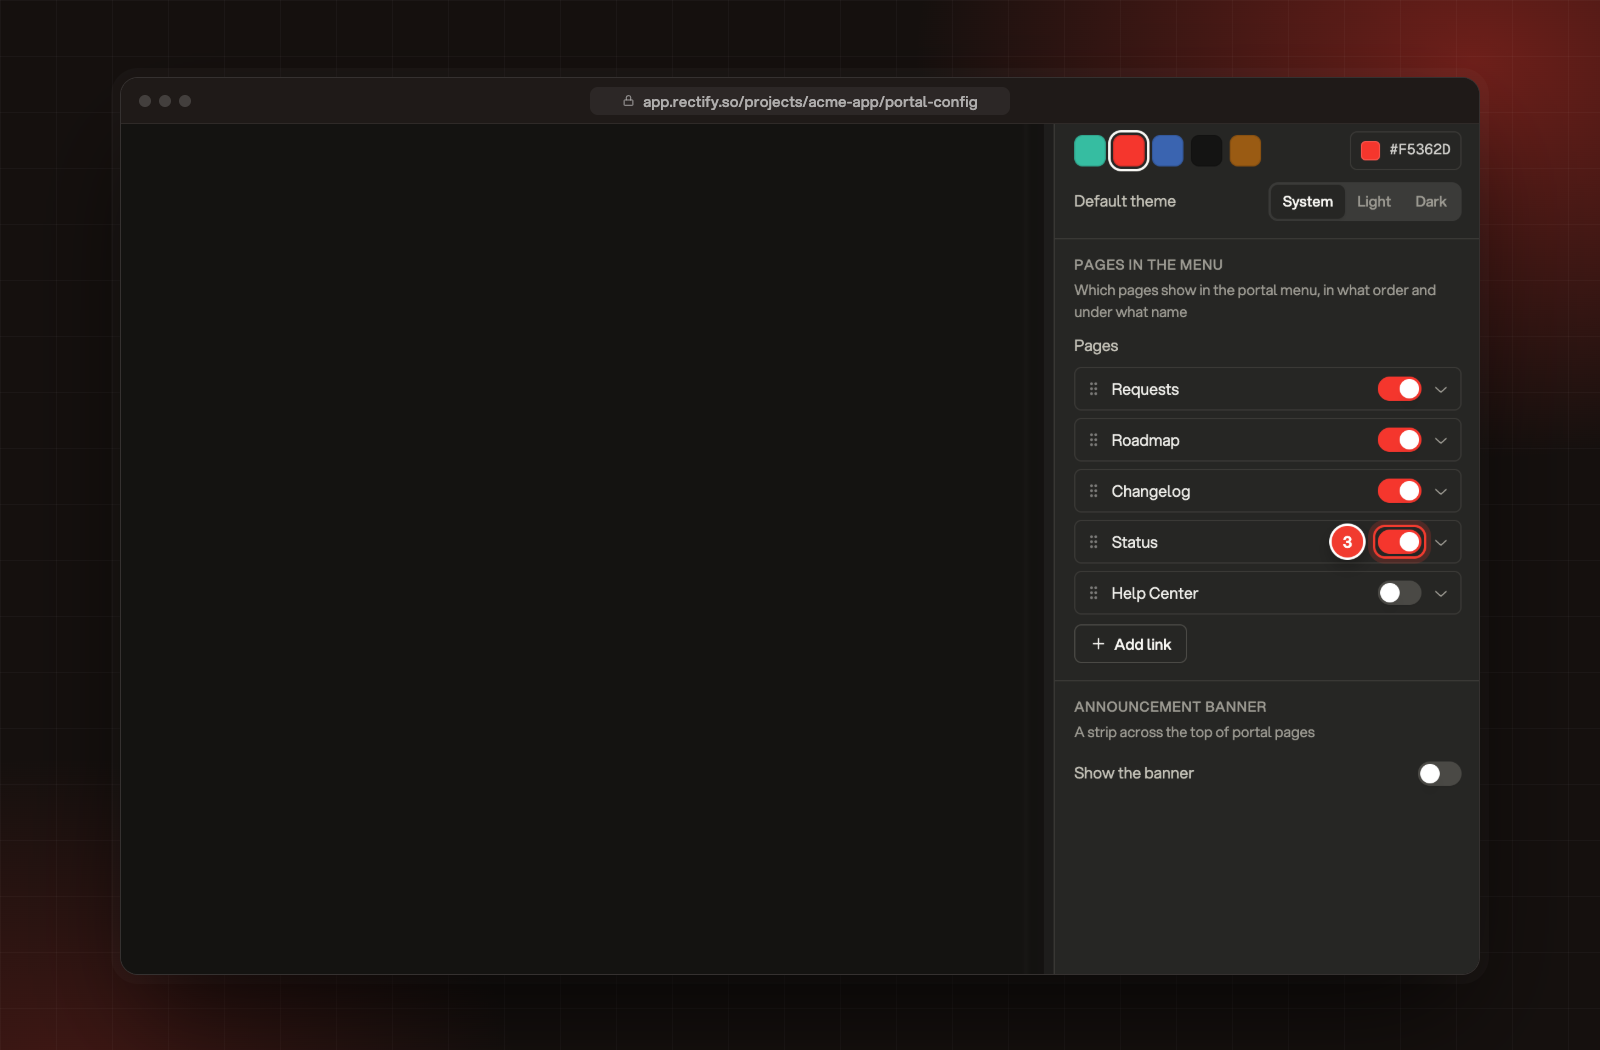
Under Pages in the menu, switch on Status.
3 The Status switch under Pages in the menu.
4.
In the bar above the preview, select Status. The first tab on the right now holds the status page settings.
5.
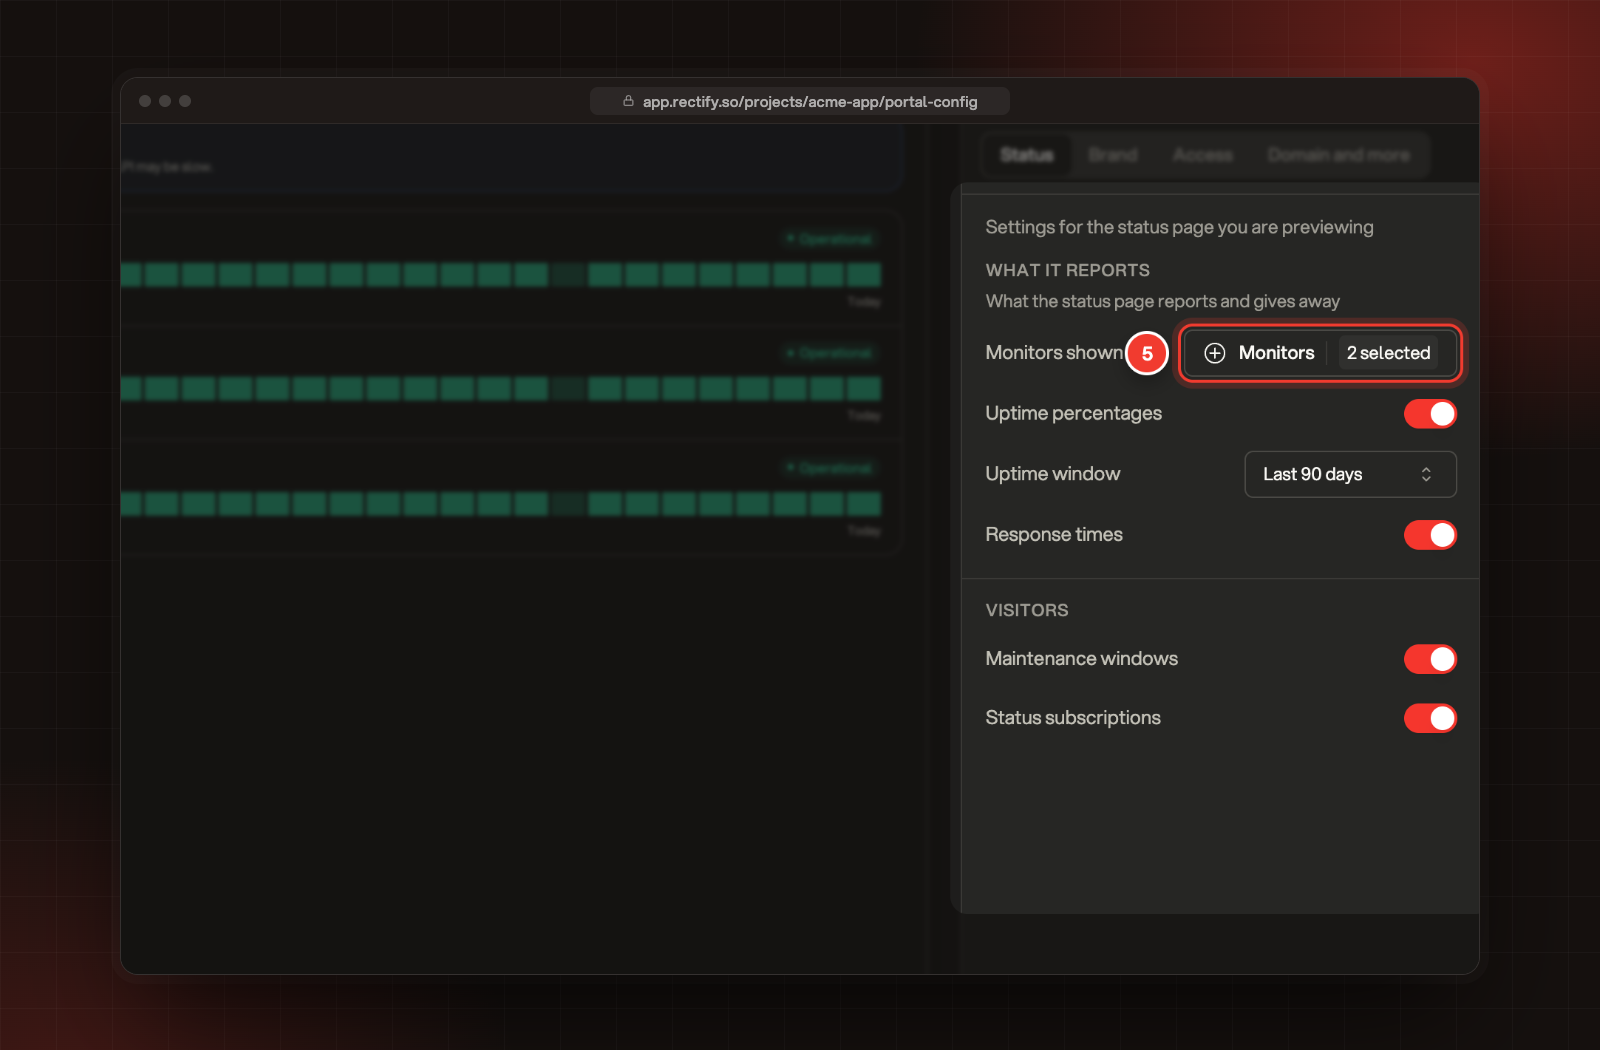
Next to Monitors shown, open Monitors and pick the ones customers should see. Leave it empty to show every monitor.
5 Monitors shown, in the status page settings.
6.
Choose what else to show (see the table below).
7.
Select Save at the bottom of the page.
Keep the Status switch on: with it off, the page isn't listed in the portal menu and doesn't show any monitors.
Setting
What it does
Monitors shown
The monitors on the page, in the order you pick them. Empty shows every monitor.
Uptime percentages
A daily uptime bar and an uptime figure next to every monitor
Uptime window
How far back the uptime looks: Last 7 days, Last 30 days or Last 90 days
Response times
The latest response time next to every monitor
Maintenance windows
Shows planned maintenance before and while it runs
Status subscriptions
Lets visitors sign up for emails about incidents and maintenance
Pick public-facing monitors, such as your website and API. Internal ones, like a backup job's heartbeat, are better left off. Paused monitors never show.
What your customers see
The page is at your portal's address with /status on the end. Select Copy link above the preview to copy it, or View portal at the top to open it.
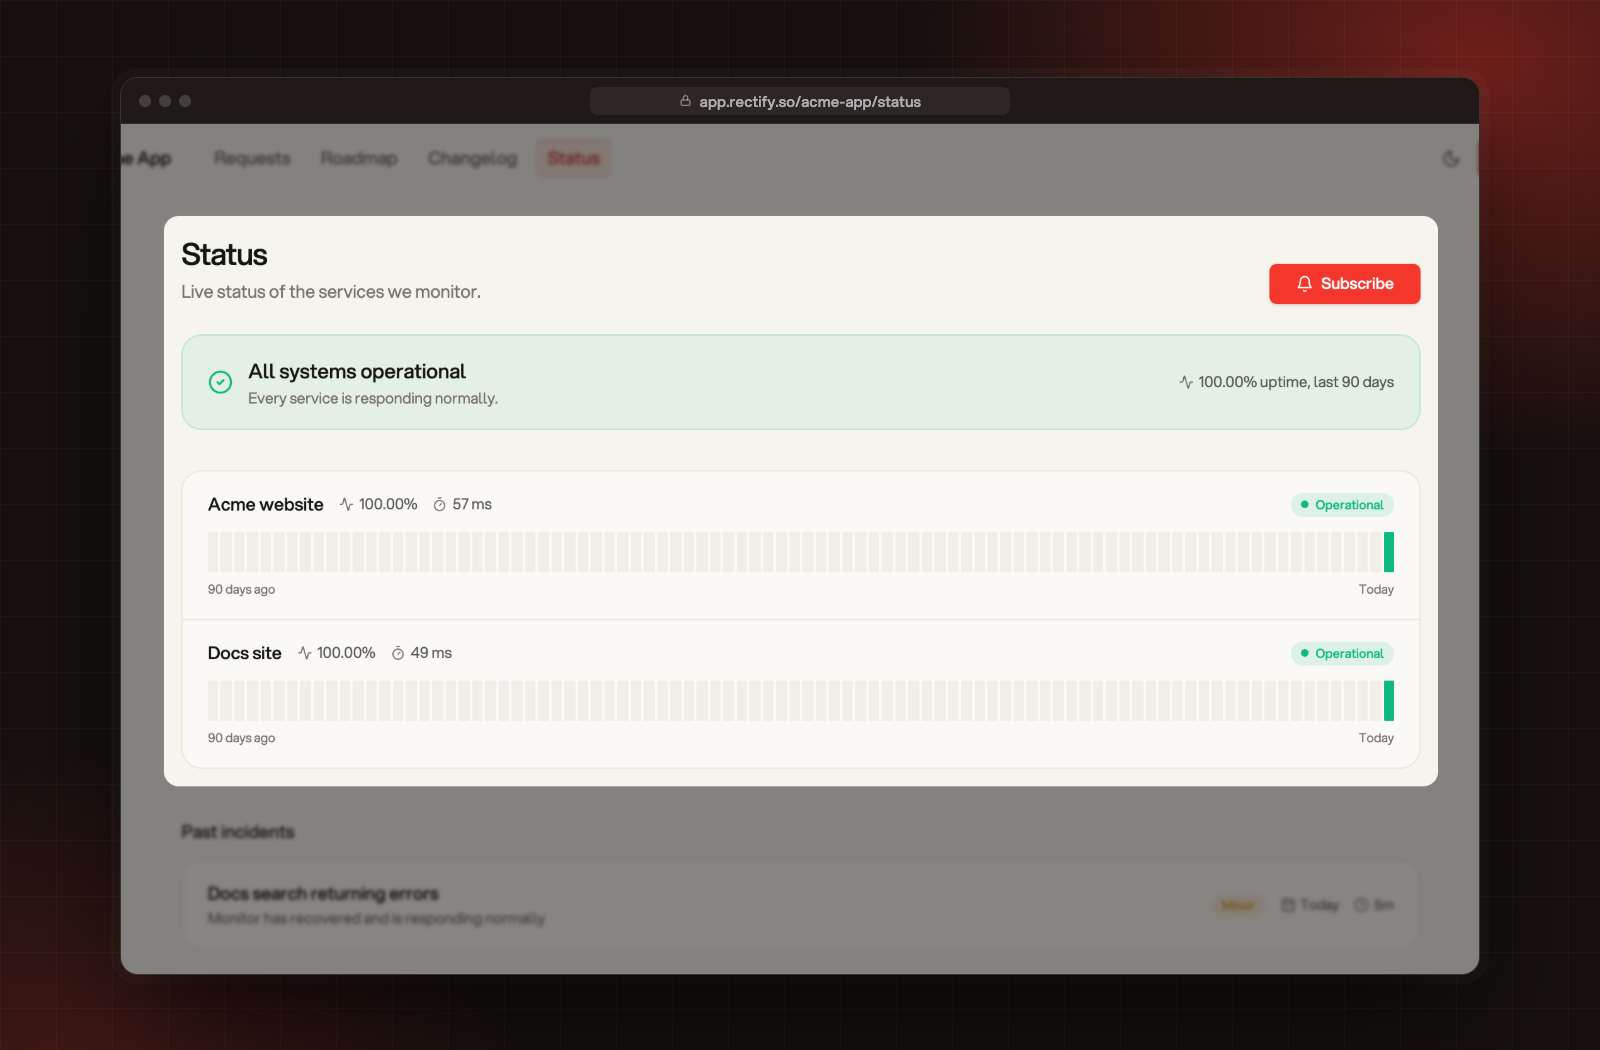
The status page as customers see it.
•
A summary at the top:All systems operational when everything is up, or Degraded performance, Partial outage or Major outage, with the uptime over your window.
•
Active incidents, with every update you post on them. See Work an incident.
•
Each monitor, with its uptime, its response time and its daily uptime bars.
Only incidents on the monitors you show appear on the page, and everything you post in an incident's updates is public. Write updates for your customers.
Let customers subscribe
With Status subscriptions on, visitors select Subscribe on the status page and sign in with their email address. They then get an email when an incident opens, gets an update or is resolved, and about maintenance windows that have Notify subscribers on. Every email has a link to unsubscribe.
Check it worked
Open your portal in a private browser window. Status shows in the menu, and the page lists the monitors you picked with their current state.
The page says "Nothing is being monitored yet"
Check Status is switched on under Pages in the menu on the Brand tab and that you saved. The page also needs at least one active monitor in this project. Paused monitors aren't shown.
An incident isn't on the status page
Incidents only appear for the monitors you show. Add the monitor under Monitors shown, or leave the list empty to show every monitor.
Next, keep customers posted during an outage with Work an incident.